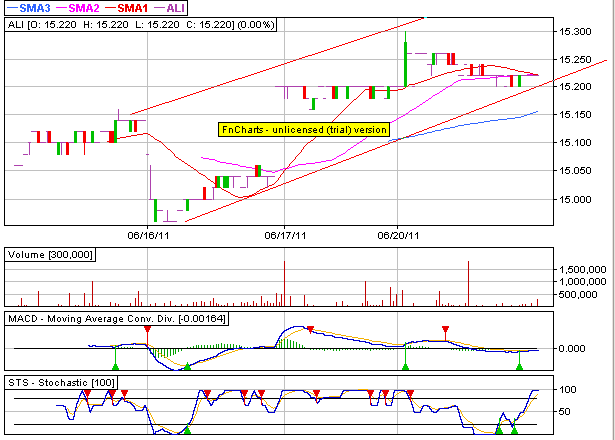
First: Row: Moving Average Convergence-Divergence (MACD)
It appears that the faster moving average (red line) is about to cross the slower moving average (blue line). If the red line crosses-over the blue line, it means a buy signal for this stock.
Second Row: Relative Strength Index (RSI)
The RSI is forming higher lows while the prices on the charts are forming lower lows. This looks like a positive divergence to me, which is a bullish sign.
Third Row: Chart Pattern
Prices are building support at P14.84-P15, and last price is about to intersect with the 15-day moving average (red line). It can mean that the stock is starting to bottom out (safe to buy). Once prices move up and maintain above the 15-day moving average (red line), the ALI can do a short-term bull rally.
Fourth & Fifth Row: %D Stochastic & %K Stochastic respectively
%K stochastic is above %D stochastic, which can mean bullishness. %K is at 32.0755, still leaning towards oversold conditions.
The second chart shows the intra-day chart of ALI (3 min. chart). When you see the daily chart above, it looks like the stock is in a downtrend. However, the 3 min. chart shows that ALI is in an uptrend today. Perhaps tomorrow, this uptrend can still continue.
The only thing negative that I see is that most of the foreign brokers, save Macquarie, are on the bear's side -- at least today. Philippine Equity Partners (PEP) is the top buyer today and the prior week.

No comments:
Post a Comment